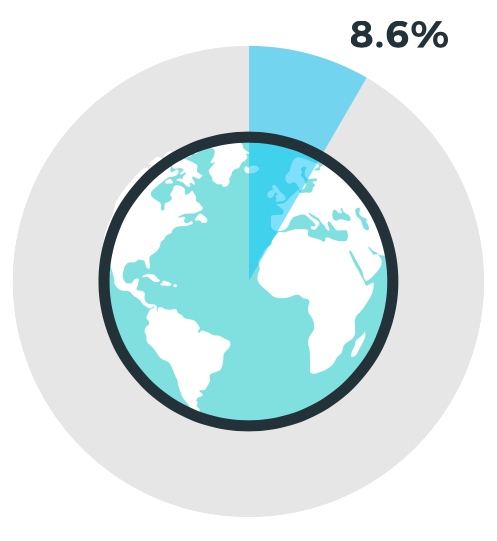
The Circularity Gap Report 2022: the world is only 8,6% circular
In 2017, Circle Economy recognised the urgent need to accurately measure the circular economy. So far, there was no global baseline measurement on the circular state of our world or data available to truly understand how we can effectively move towards circularity or monitor progress.
That is why, in January 2018, the first Circularity Gap Report was published during the World Annual Forum in Davos. This first report established that our world is only 9.1% circular, leaving a massive circularity gap. It also provided a framework and fact-base to measure and monitor progress in bridging the global circularity gap. In January 2019 the second edition of the Circularity Gap Report was launched, reiterating that our global economy is stuck in reverse and failing people and the planet.
From 9.1% to 8.6% circular: What is going on?
From the bicycles we ride, to the books we read and the buildings we inhabit, nearly all facets of daily life are shaped by materials. And as we do more – be it travelling, buying goods and even eating – we use more resources. Of the 100 billion tonnes of resources that the world uses every year, by 2022 only 8.6% is cycled back into our economy: over 90% of what we take from the earth to fulfil our needs and wants goes to waste – our throwaway society in practice.
This rate of extraction continues to threaten the planet’s future – and our lives on it. Yet forecasts paint a grim future: according to the International Resource Panel, material use may increase to between 170 and 184 billion tonnes in 2050 if business as usual prevails.
The circular economy provides a framework for decoupling growth from material extraction: it can create the conditions for sustainable development, meeting the needs of the growing population without relying on the use of primary resources.
Three consecutive Circularity Gap Reports were devoted to answering the question of how circular the global economy is and identifying the key levers to move us towards circularity with a focus on mass. Initially, the inspiration came from the UN’s Emissions Gap reports – and for the 2021 analysis, the Emissions Gap returned to the fore, with the task of quantifying how closing the Circularity Gap could also help to close the Emissions Gap.
Only two years after the 9.1% measurement, the analysis found that the circularity of the world had fallen to 8.6%. And we now know that material use is not only increasing, but accelerating beyond even population growth. Since 1970, the American population has grown by 60%, disproportionately accompanied by an increase in consumer spending of 400%: a trend common among nations with an expanding middle class.
It was found that our climbing rates of resource use are responsible for catapulting billions of tonnes of human-made GHGs (greenhouse gases) into our atmosphere – 70% of emissions, to be precise. In 2019 alone, we emitted 59.1 billion tonnes of GHGs to satisfy global needs and wants. The Circularity Gap Report 2021 quantitatively mapped how GHG emissions and resources move through our economy, from extraction to end-of-use.
What is causing this negative shift?
Overall it can be explained by two related, underlying trends:
1. Our growth rate of resource extraction outpaces improvements in efficiency and in end-of-use recovery by a factor of two to three – and as a result, the quantities of secondary materials available for use are falling short.
Ultimately, our limited capacity to cycle materials at an equal level around the world means that quantities of secondary materials available for reuse fall short: we still need huge amounts of virgin materials to satisfy our lifestyles. Overall material consumption must also be reduced to narrow flows: if the common denominator (consumption of primary materials) keeps growing, our advances in material efficiency and cycling can never keep up. The processes still entail resource extraction.
2. To serve the needs of a growing population, we keep extracting materials to build housing, infrastructure and heavy machinery – we should make use of what is already there.
Countries are continually investing in new buildings and infrastructure to meet a variety of societal needs. Current estimates suggest that 255 billion square metres of buildings exist across the globe – a figure expected to almost double within the next four decades. This is equal to erecting cities the size of Paris every week. This stock build-up is not inherently bad; many nations need to invest to ensure access to basic services. But as our global population is projected to swell to 9.9 billion over the next 30 years and land-use concerns come to the fore, we’re increasingly building up.
This is concerning as tall buildings are inherently unsustainable: skyscrapers require extra resources for foundational and structural support: namely, cement. Cement use is extremely emissions-intensive but demand continues to rise. Also, increasing renewable energy generation, distribution and storage capacity to regenerate energy flows will entail building up infrastructure, such as wind turbines or electrical grids. Fortunately, this is happening at scale: G20 members have set new records in building capacity for solar and wind power – nearly doubling the amount of wind power produced in 2020 compared to 2019.
Regardless, when materials, mostly minerals and ores, are invested into stock in the form of buildings, infrastructure and heavy machinery, they become embedded and unavailable as secondary materials for as long as they remain stored and in use. It is, therefore, paramount that virgin resources are not extracted to continue building up this stock, but rather that we design, produce, maintain and reuse buildings, roads and machinery in a circular manner to cycle flows.
Mobility, Housing and Nutrition account for almost 70% of global emissions
- Mobility has the largest emissions footprint at 17.1 billion tonnes – largely due to fossil fuel use across passenger and freight transport. The production of automobiles, trucks, trains and aeroplanes is relatively limited in emissions contributions.
- Housing, at 13.5 billion tonnes of emissions, has the second largest contribution. This is due to the vast extraction, transport and construction activities it entails, as well as the energy used to light, heat and cool our homes.
- Third in line is the provision of food for Nutrition, which contributes 10 billion tonnes of emissions.
- Land use, land-use change and forestry (LULUCF) – a GHG inventory sector referring to emissions from human land-use activities – is associated with the production of food, but also fibres and clearing for the expansion of urban centres, and is responsible for about 4 billion tonnes of emissions.
- The remaining 30% of emissions flow into satisfying our need for Communications, Services, Consumables and Healthcare.
21 Circular solutions for a 1.5 degree pathway
The 2022 report presents a roadmap of 21 interventions across six scenarios that can mitigate climate impact by curbing GHG emissions. You can see the roadmap here.
Some interventions overlap, which means that the total combined effect is significantly less than when all individual interventions are simply added together. This is because some interventions, when combined, will partially cancel each other out. For example, in ‘Reduce floor space’, we also reduce the volumes of construction and demolition waste (C&DW) that become available for recycling and repurposing. Another example is the absolute impact of lightweighting the global car fleet in ‘Vehicle design improvements’, which is directly moderated by the size of the said fleet, which in turn is reduced by, for instance, car sharing.
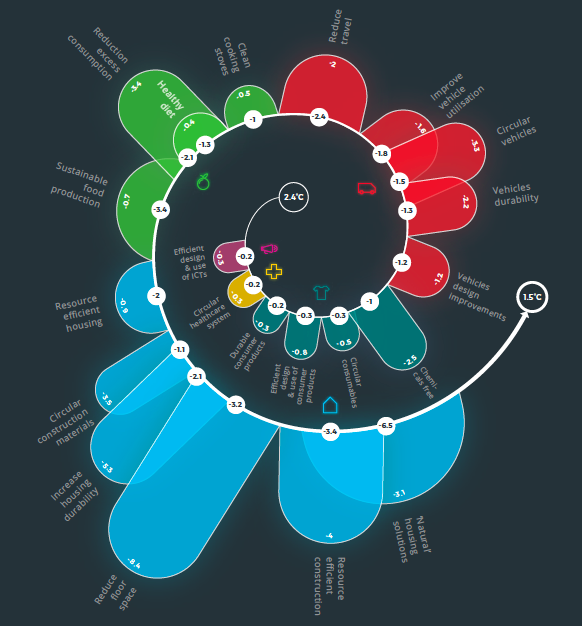
Together, the combined interventions can almost double the current global Circularity Metric of 8.6%, bringing it to 17%. This results in:
- Shrinking global material use and extraction by 28%.
- Cutting global GHG emissions by 39% – fully closing the Emissions Gap as defined in our report and taking into account the updated NDCs.
- Allowing the world to achieve the Paris Agreement’s goal of keep at 1.5-degrees of warming by 2032.
//
Article source & images: https://www.circularity-gap.world/2022
